(Aside- what in the world was the Longmont CBC originator thinking when they placed their circle too close to our already existing circle, creating an overlap? And what was National Audubon thinking to accept the boundary that ate into our circle to the tune of many, many square miles and good habitat? Arghhh....)
Update: The free version of Google Earth now has the drawing tools needed to accomplish the following steps- yea!!
Anyway, I quickly realized that the free version of Google Earth didn't have the drawing tools to do this, but by upgrading to Google Earth Plus ($20 annual subscription), I could draw polygons around the LEZ (Longmont Exclusion Zone) and each of the territories. A few notes:
1) While Google Earth Plus is needed to draw the polygons, the free version is fine for viewing and exploring them.
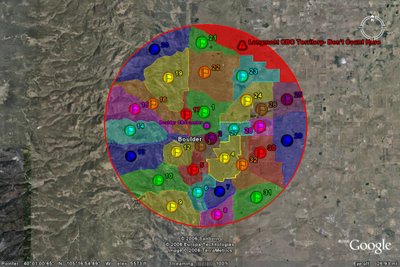
2) The count circle center, circle, and the territory areas and labels are all saved as a set in a .kmz file that can be shared, sent, etc. When you open the file it looks like this (click the images to enlarge):

3) While there are 30 territories, you will note that they are numbered 1-32, with 11 and 18 missing. They were folded into other territories over the preceding years, but the original numbering was kept on the remaining territories to avoid confusion.
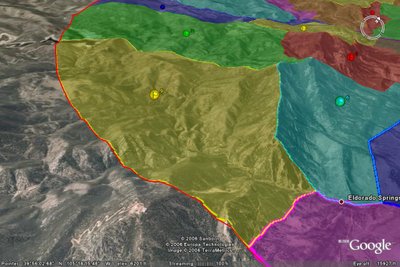
4) To explore a territory, you can zoom in to that area, pivot the compass heading &/or tilt the viewing angle to your heart's content. For example, zooming in to territory # 9 (Eldorado Canyon) & changing the viewing perspective & tilt might look like the following. You can see the relationships between this territory and its neighbors, what features define the boundaries, where the count circle radius intersects roads, etc.
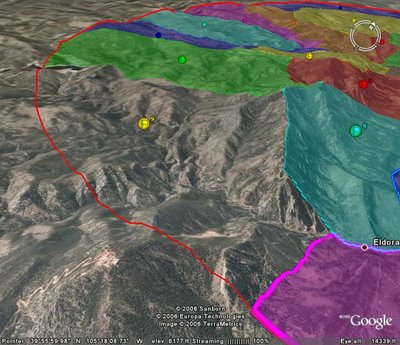
 5) The shading is nice for defining all of the territories, but might be annoying when you are trying to see details of the territory you are interested in. You can edit the amount of shading by selecting the territory, right-clicking, selecting "properties (pc) or "get info" (mac), choose the "style, color" tab, and changing the amount of shading (it is now at 40%.) Even better, you can uncheck that territory, which will take out all of the area shading. Since the circle and surrounding territories are still selected, you can see your territory just fine without the coloring. Here's territory 9 again, without the shading. Remember that if you are really running Google Earth, you can zoom way in for details, move around, etc.
Let me know if you want me to send you the .kmz file to play with, or if you have other/better ideas for setting up Christmas Counts using Google Earth.


2 comments:
Ooooh, nice!
I'd like to pimp this. Any objections?
Post a Comment